This dashboard allows you to generate visual charts for your revenue, reservations, coupon usage, and payment gateways used. It is located under Appointments > Analytics.
Common filters you can use to build your charts:
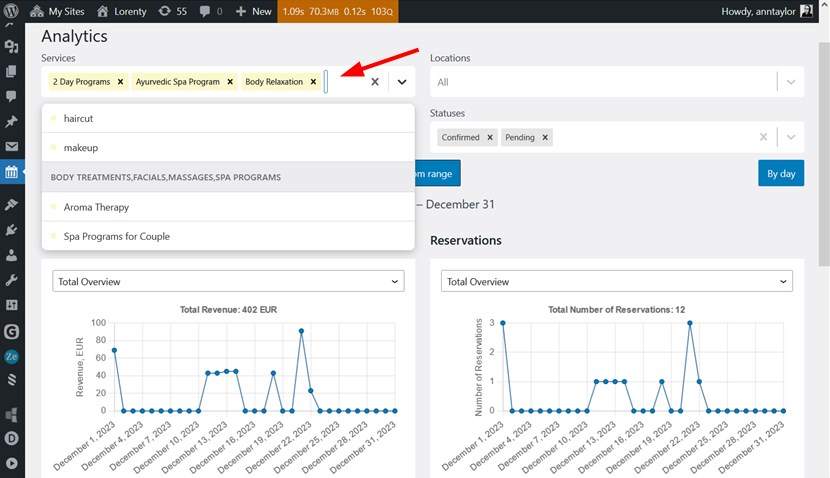
- Service filter: choose all or individual services.
- Location filter: choose all or individual locations.
- Employee filter: choose all or particular employees.
- Booking status filter: all or confirmed, pending, and canceled statuses.
- Date range filter: pre-selected or custom range. By default, it shows ‘today’.
To choose multiple items in the filter, just select them one by one from the drop-down menu.
You can create charts for the revenue, reservations, coupons, and payments.
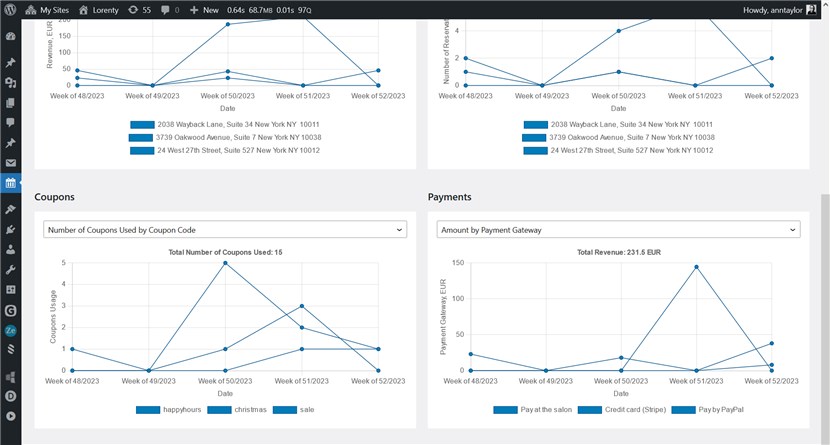
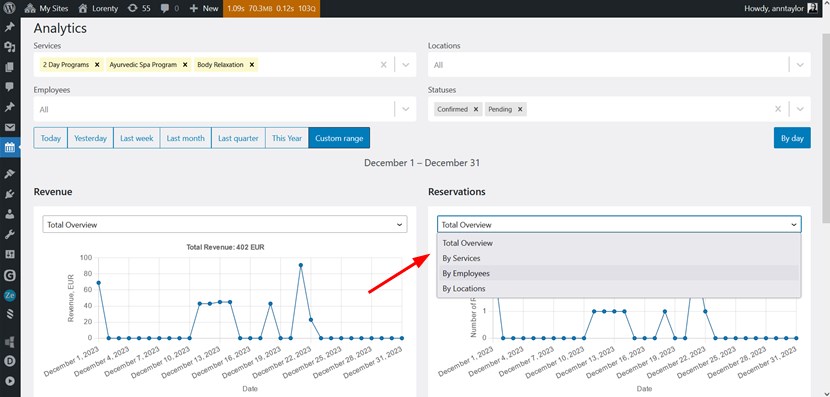
Each of them comes with their own subfilters.
You can click on the names in the chart legend to display data only for those items that are left.
Hover your mouse over the chosen line in the chart to see more details.
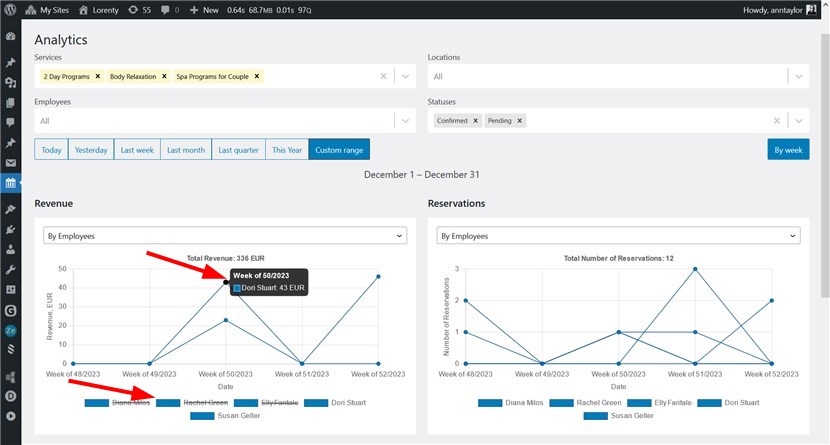
Choose a day or week for data presentation. If you choose a one-day range, you will see hourly data in the chart.
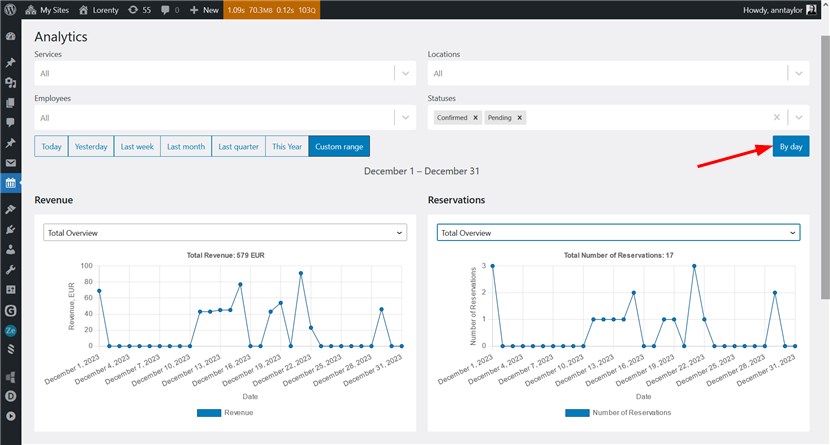
The charts show data for the dates of actual appointments.