Hotel Booking Plugin 3.9.7: Visualize Your Sales with the New Revenue Chart
Table of Contents
Since MotoPress Hotel Booking version 3.9.7, you have access to the improved Reports menu you can find via WP dashboard > Bookings > Reports.
An upgraded version of this menu is now divided into two tabs: Reports & Export. The Export menu is the same – it allows you to easily generate and download bookings data in a CSV format.
The new tab, Reports, will help you see all your sales and bookings within a chosen period of time in a graphical representation.
Note: this new menu is in beta, which means there are a lot of updates in the pipeline.
This stats chart will help you visually compare your earnings and bookings by dates, identify low and high seasons, notice any sort of regularity and find the reasons for them. It will also help you see how much you generate particularly from the extra services, for example, or how much you earn after taxes. And all this information will be presented in an easily comprehensible visual mode!
Hotel Booking Hotel Booking + ALL Addons Bundle
Learn how it works for linked accommodations.
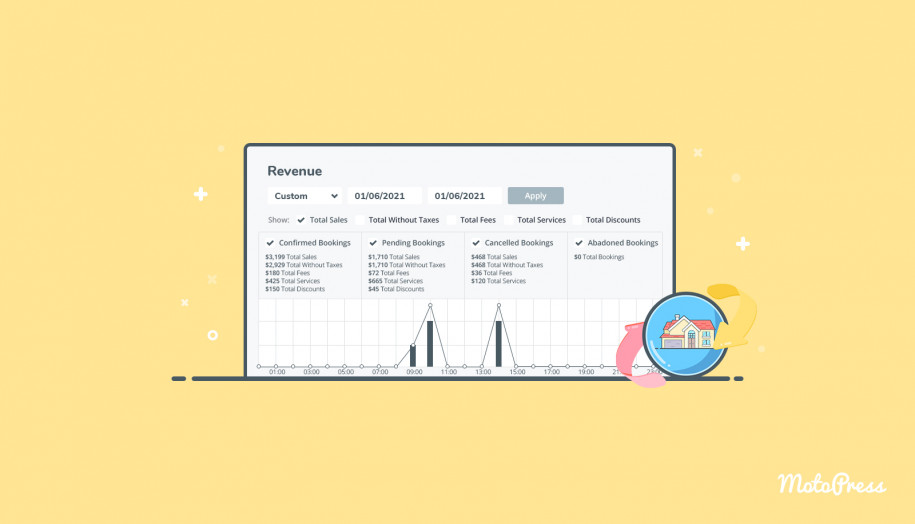
When going to the Reports tab, you’ll see a bar and line chart that by default shows your bookings and sales in the last 30 days, you can change the view, though.
The chart is color-coded so each group/filter you choose will be highlighted.
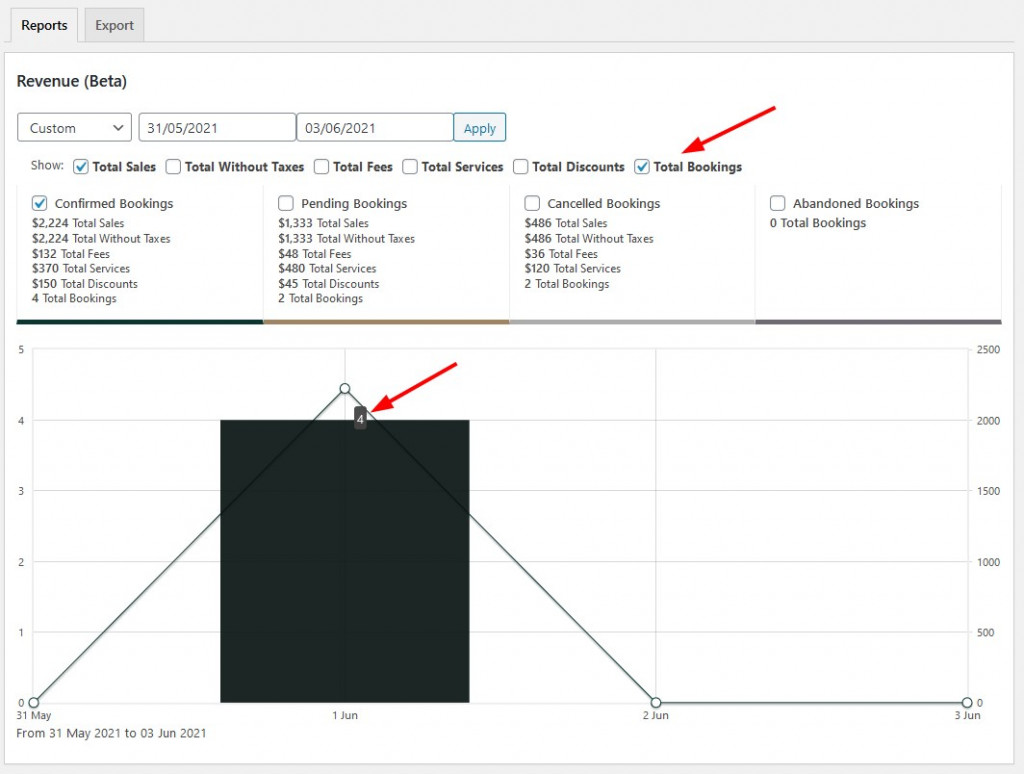
The chart is grouped (shows several bars per day) and interactive, namely, you can hover your mouse over any bar/line and see how many bookings were made that day or see any other available data.
What you see in the chart directly depends on what filters/categories in the legend are applied.
- Hover your mouse over the bar to see the number of bookings.
My example below shows that on June 1, my property received 4 bookings:
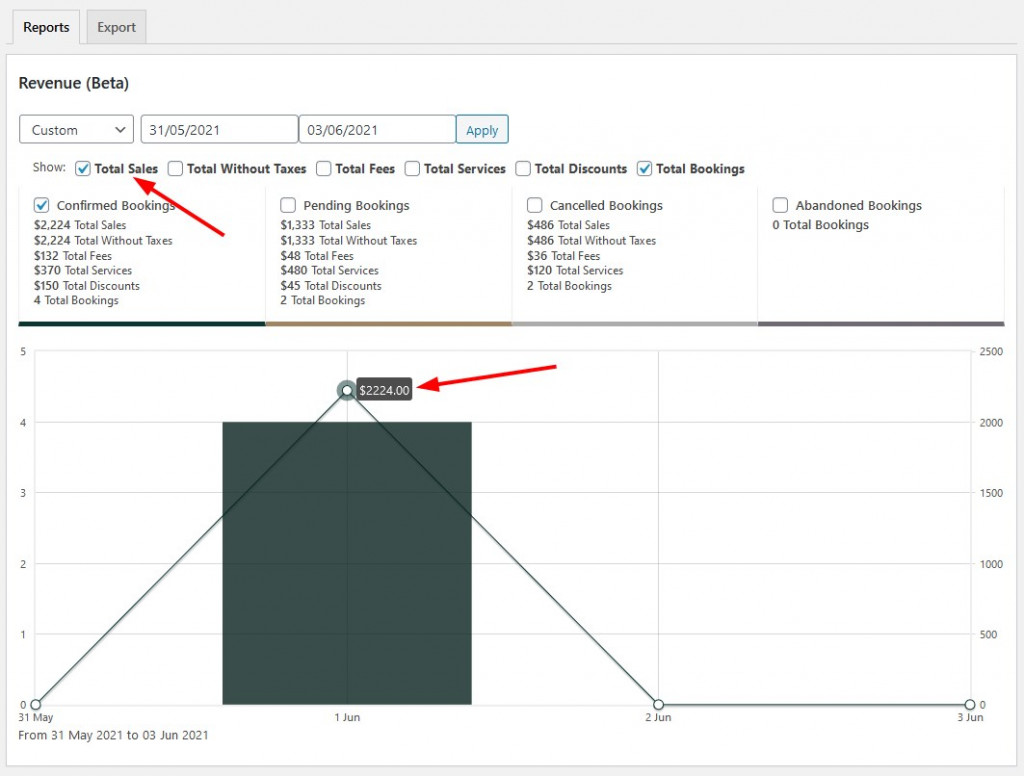
- Hover your mouse over another bar to see total earnings.
It shows how much money I generated from those four reservations.
By choosing a custom period here, you can scale the chart so that all the data can fit on the screen.
How you can filter the chart view: Legend levels
Although this chart is extremely handy to work with, let’s see how you can play with it.
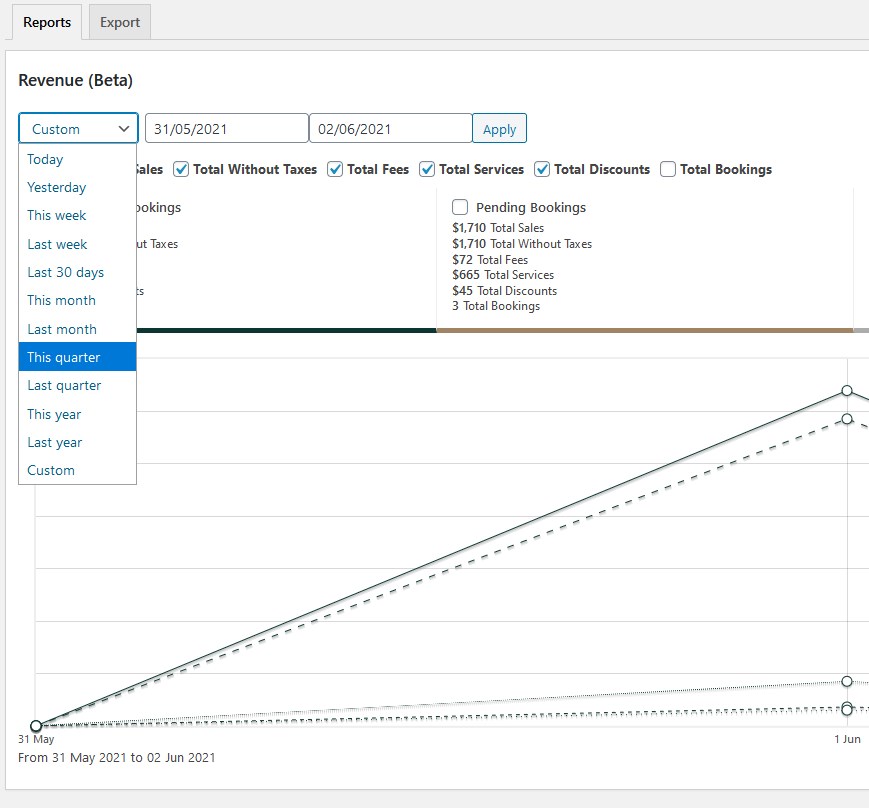
First of all, you should choose the period to track your performance. There are many preset periods as well as the ability to choose a custom one:
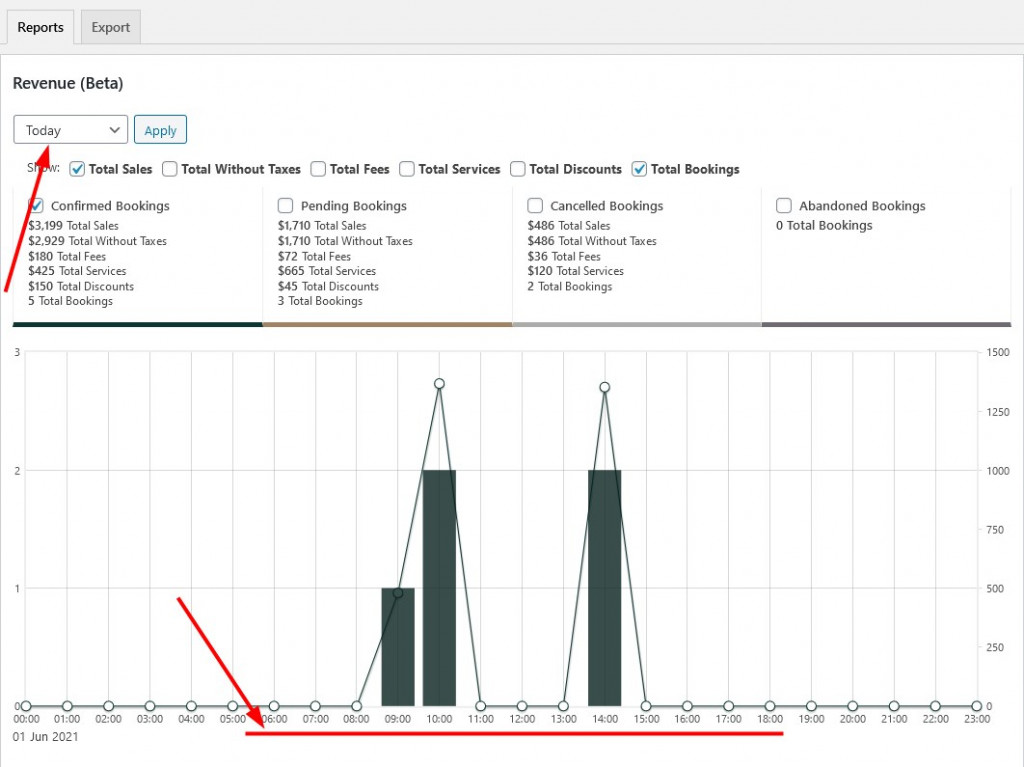
Please note that Today and Yesterday periods will show your bookings by hours, not dates:
Or, for example, opting for the This year view, you can compare your revenue by month.
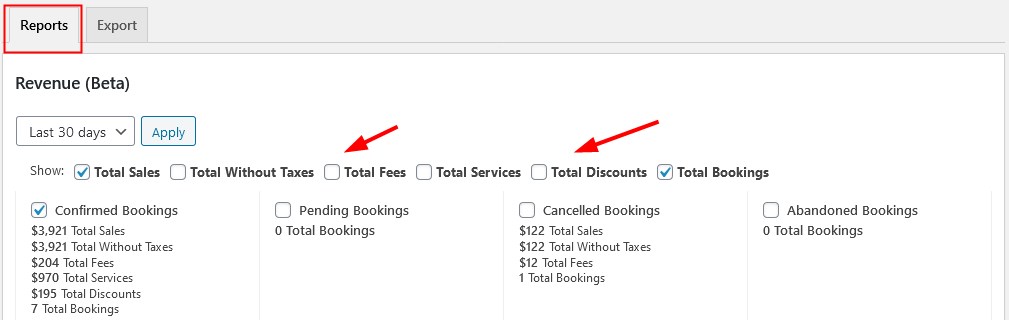
Next, you can filter the categories to see the following data visualized:
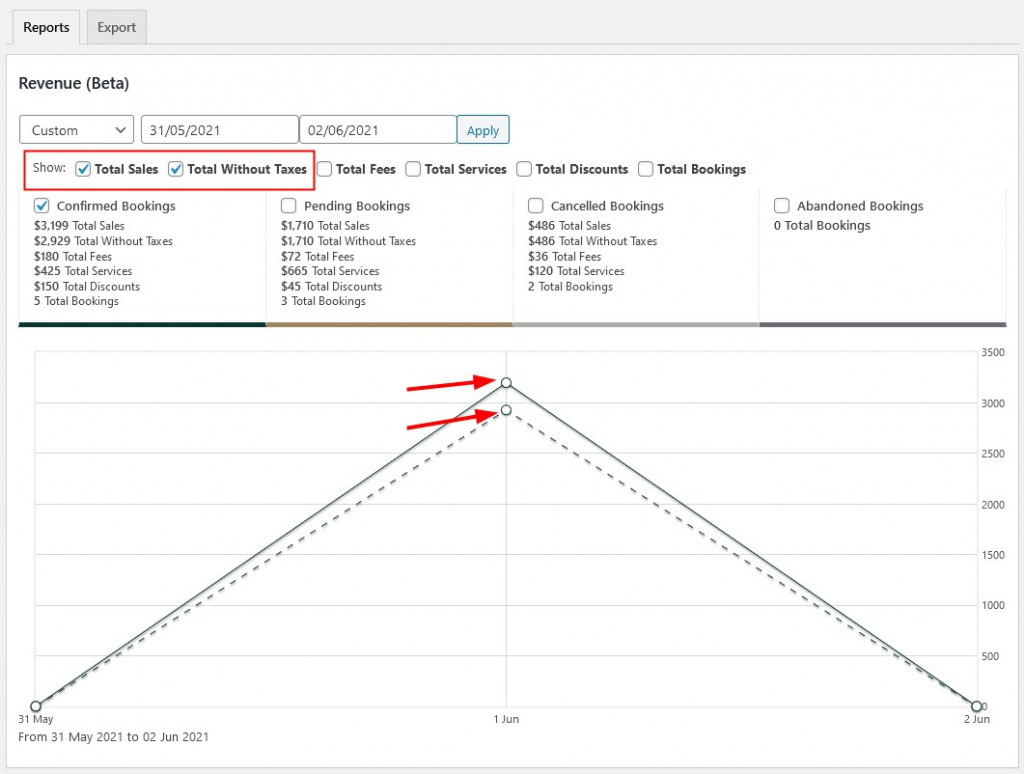
- The Total sales bar shows the total sum of money you earned including taxes, fees, extras, etc.
- The Total without taxes filter shows, respectively, your earnings excluding taxes.
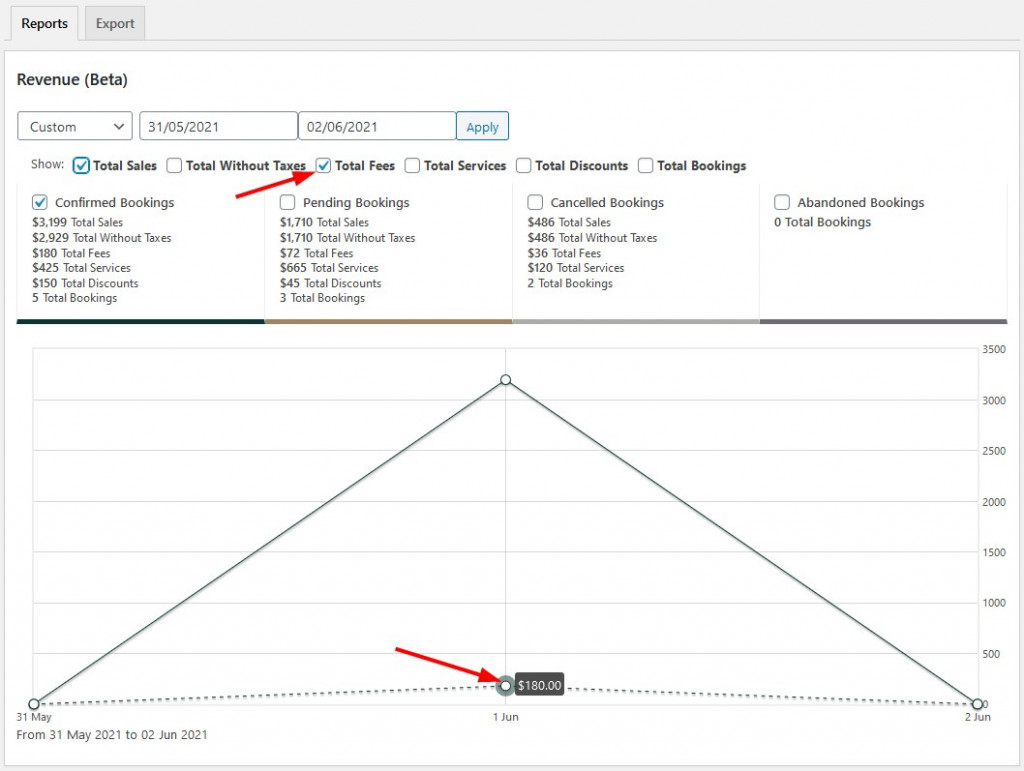
- The Total fees bar displays which sum of the total sales is fees.
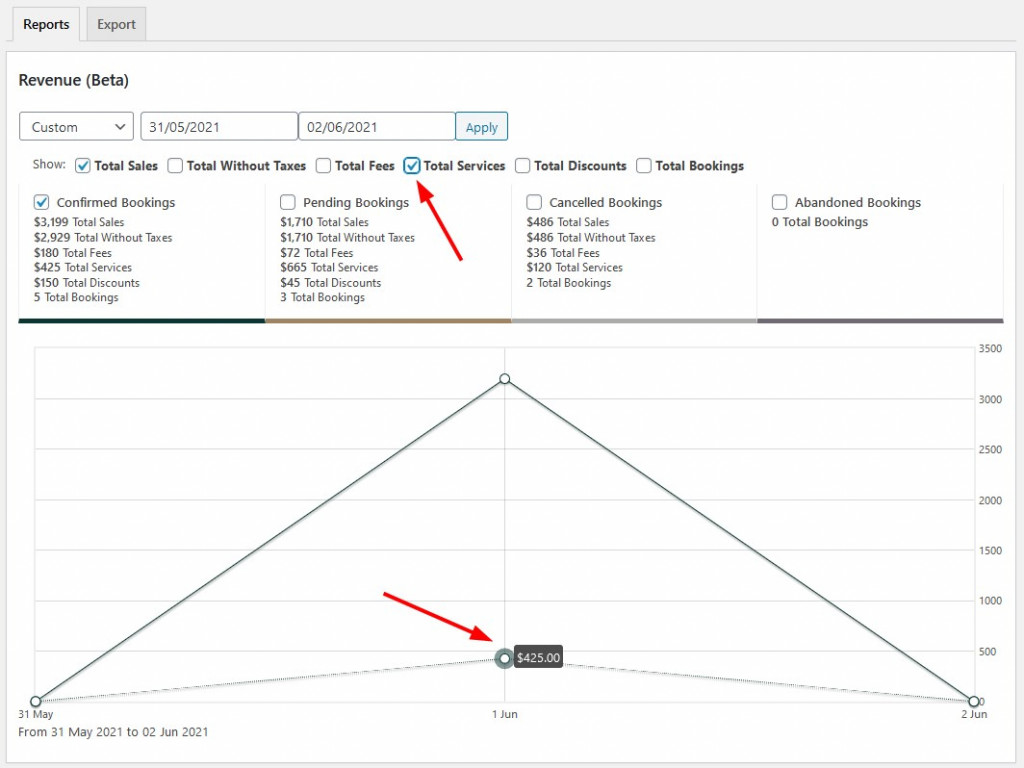
- The Total services bar visualizes which part of the total sum is the money you earned from extra services booked by clients.
- Total discounts allows you to see what sum of money you spent on discount coupons.
- Total bookings shows the number of all confirmed bookings.
The Total bookings bar is the biggest one in the chart so it might really be excessive if you want to check your stats in other categories, e.g. Total discounts. So if you want to get a clearer view, feel free to uncheck Total bookings.
The next level allows you to see the exact revenue you generate/lose from the guest actions. It shows Confirmed, Pending, Canceled, and Abandoned bookings.
All the revenue information is sourced from the confirmed bookings. If you tick only the Total sales category, you’ll see total earnings, including taxes, fees, extra services booked, etc.
We also decided to make it super handy by listing all the extra data under each filter so that you can see, for example, the total sales number and the total sales after taxes right away.
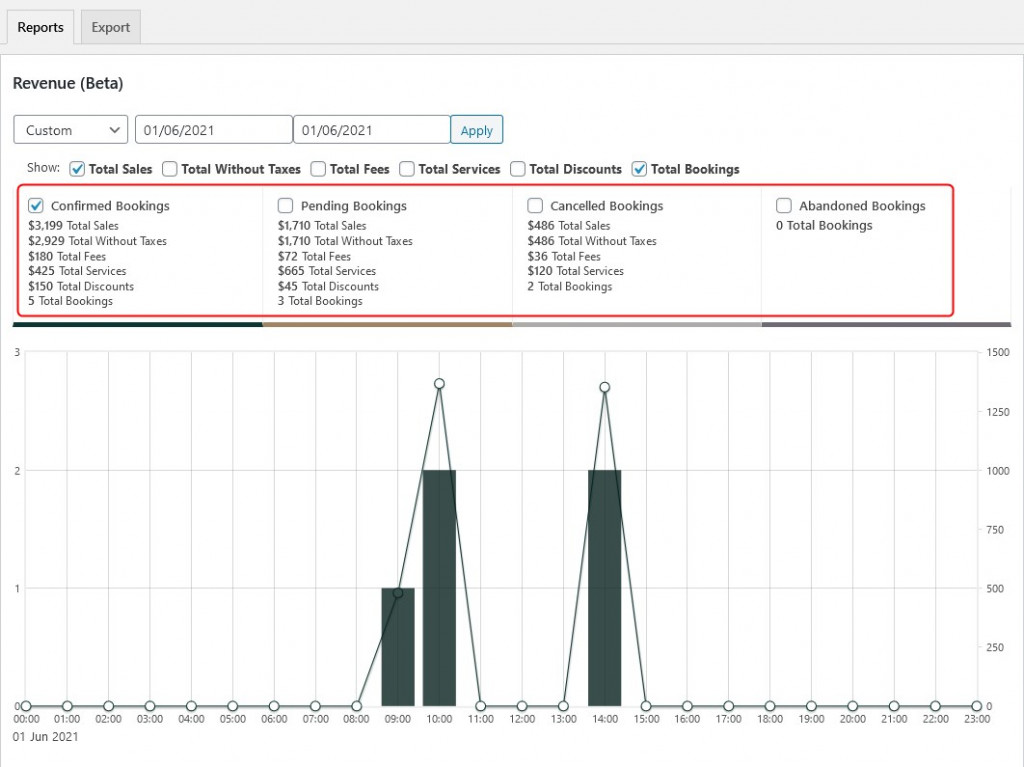
In addition to the total sales and total sales without taxes, this menu allows you to see when guests canceled their bookings and in what loss it resulted. A canceled booking is one that doesn’t have the status “confirmed”
There is also a dedicated checkbox for Pending bookings – since they are to be confirmed, we think it’s essential that you can also see your possible earnings.

That’s it!
Conclusion: Update Hotel Booking to Test the Waters with the Revenue Chart
That all might sound too complex but when you’ll try to test-drive it by yourself, you’ll see that it’s super handy, intuitive and there is almost no learning curve. This new feature of the MotoPress Hotel booking plugin will help you see how your hotel or vacation rental business is performing, compare your earnings by periods and also and have a better understanding of where to put your next effort.
We are also eager to hear what functionality or data you rather lack in this Revenue chart. What is super essential for getting the most out of this functionality? Let us know in any preferable way.