Visualize Your Business Performance with the New Analytics Dashboard (Appointment Booking 1.21.0)
Table of Contents
We’re thrilled to introduce you to a completely brand-new menu you can discover on your Appointment Booking plugin dashboard: Analytics.
It allows you to build visual charts about your business just by applying a few handy filters!
As its name hints, it’s made to give you data-driven insights into the performance of your appointment-based business.
In particular, you can understand the number of bookings your business made over a specific period of time, view revenue digits, money generated from coupons, best performing employees, the most selling locations, and much more, just unleash your creativity and analytical skills when working with charts.
There are two primary types of filters you should start with:
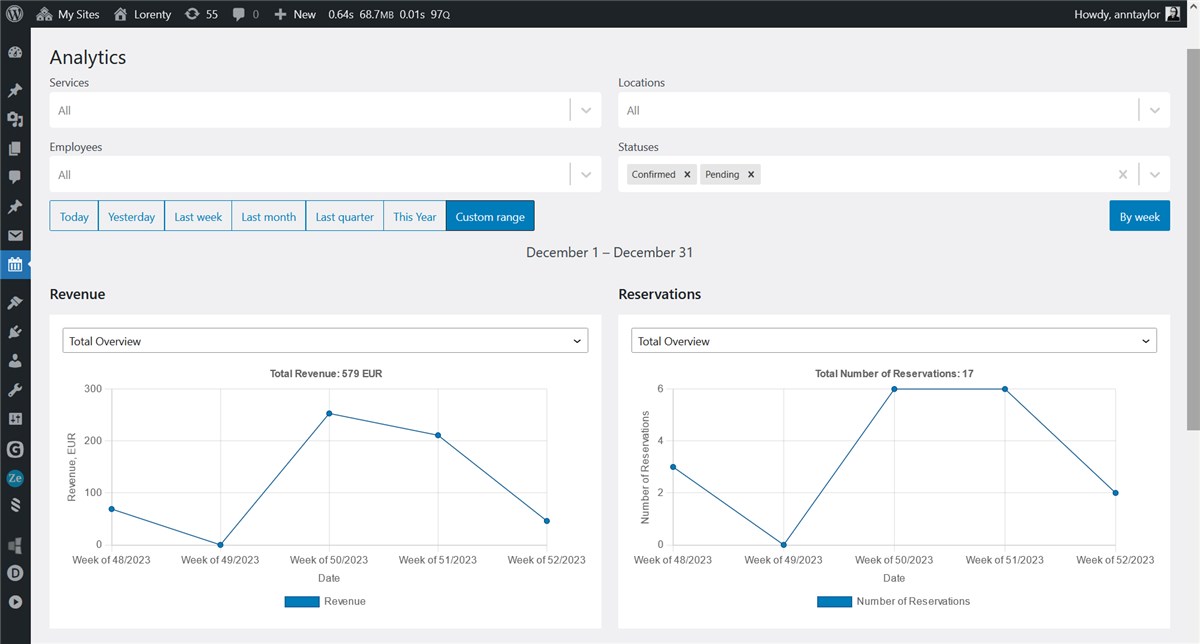
- Common filters by the key data of the plugin: services, locations, employees and booking statuses. You can choose all at once or just individual items.
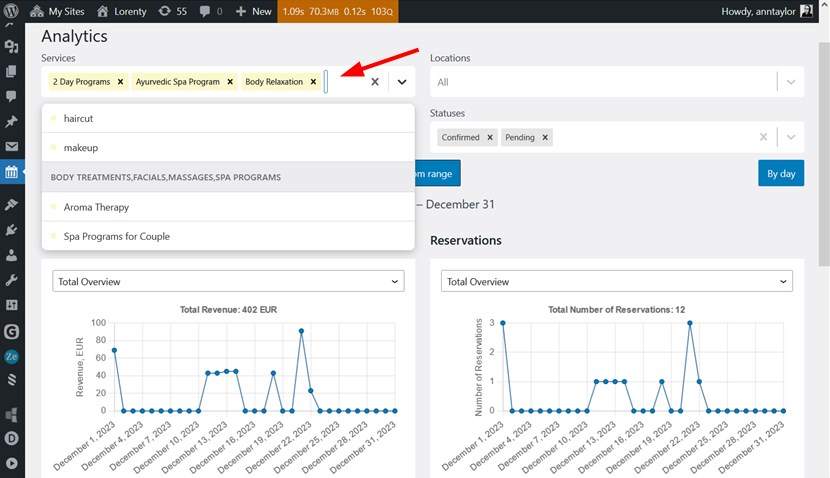
- Date filters allow you to choose a date range for generating charts, it can be any of pre-sets (today, last week, etc.) or a custom period date picker. By default, when you open the analytics dashboard, it shows your performance for ‘today’.
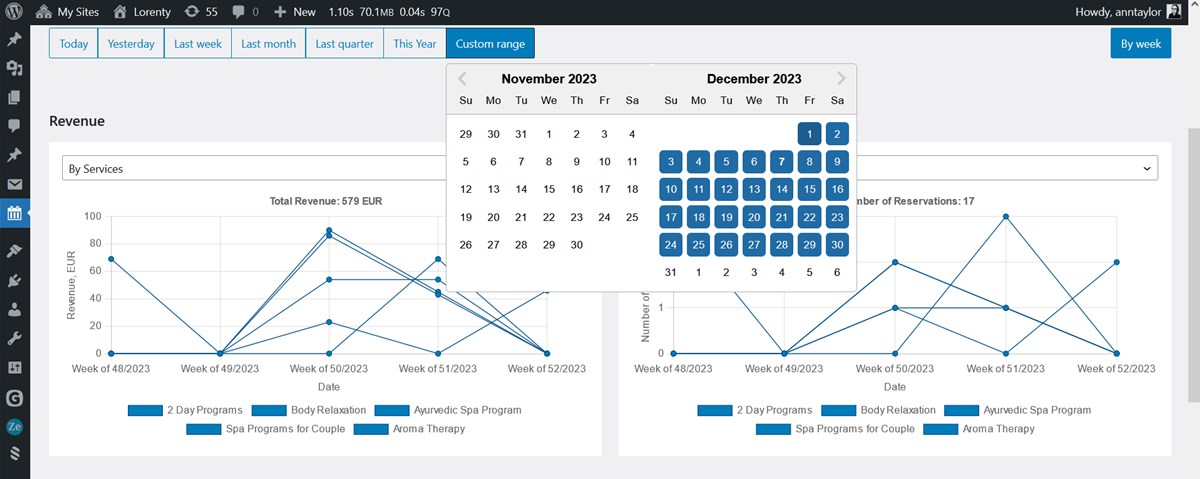
You can also tailor a chart view mode based on the date range you chose: by day, by week, by quarter, by month, etc.
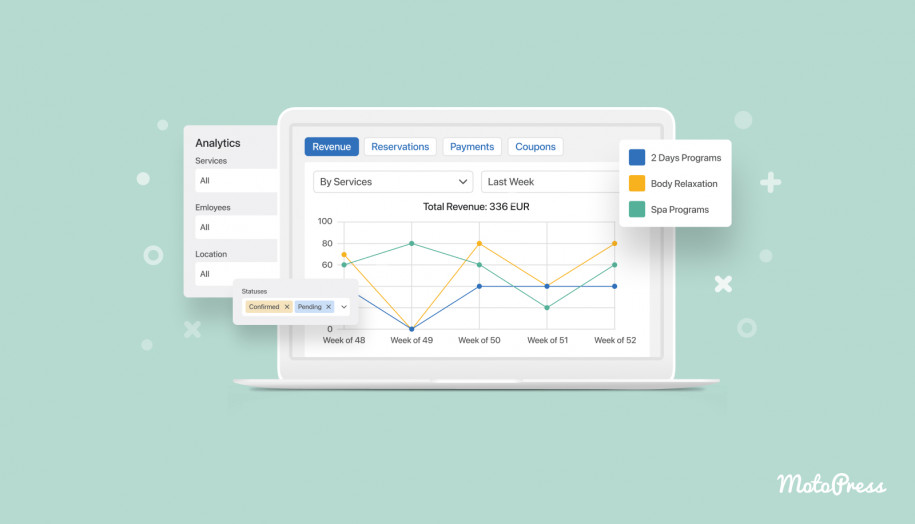
The Main Metrics of the Analytics Dashboard
Here is a list of the actual appointment booking metrics and their subfilters:
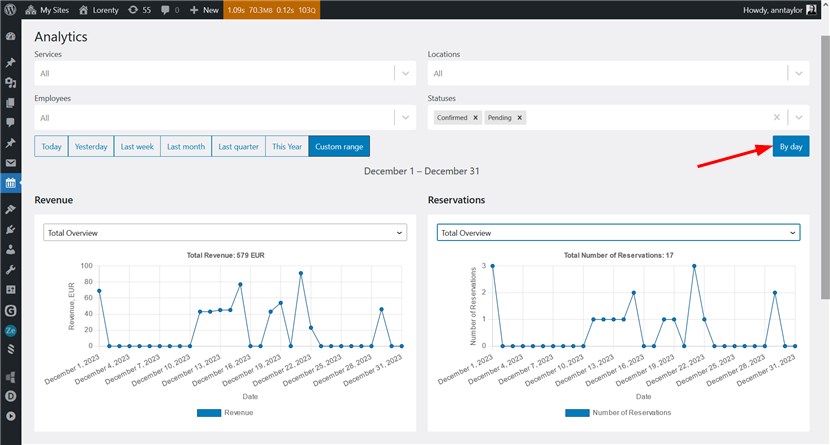
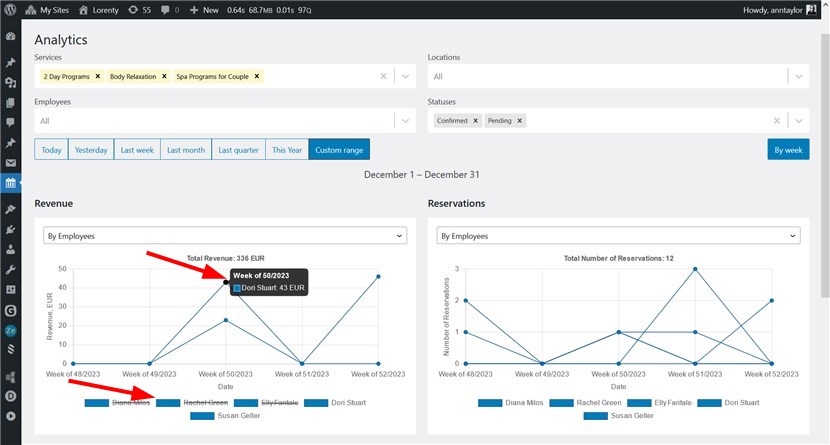
The Revenue chart can be filtered by:
- Total overview
- By services
- By employees
- By locations
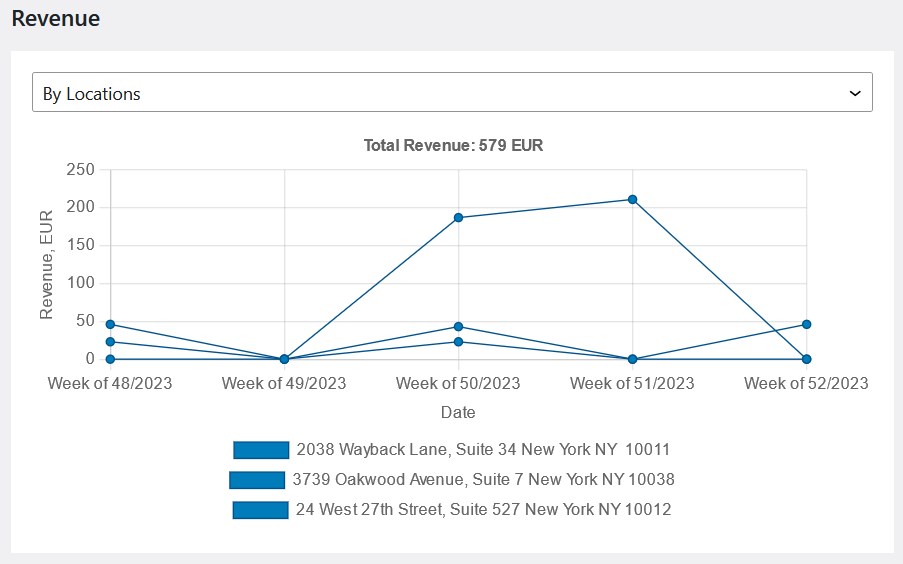
Using this chart, you can identify services that generate the most revenue, as well as see most profitable locations and staff members.
The Reservations chart can be filtered by:
- Total overview
- By services
- By employees
- By locations
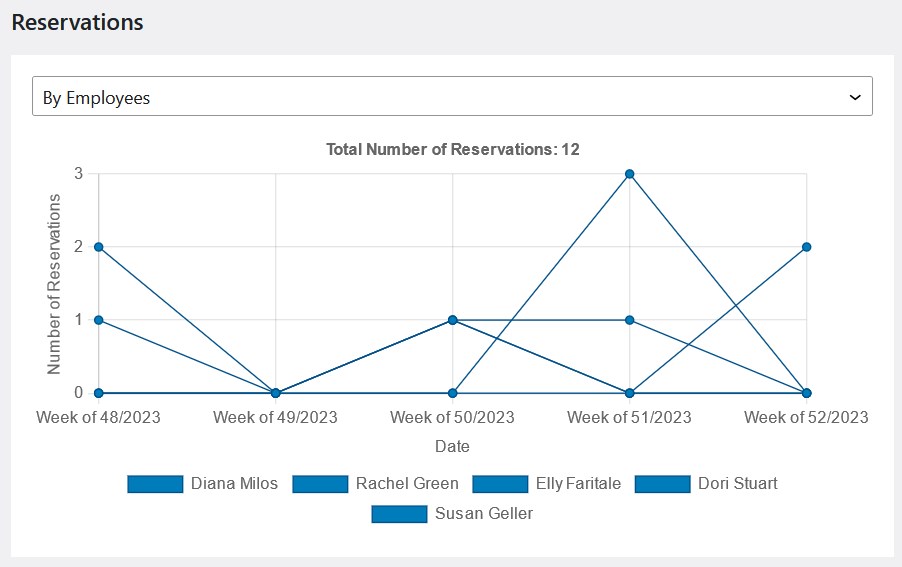
This chart provides a comprehensive overview of reservation trends by breaking down the reservation number data across various dimensions, including services, employees, and locations.
The Coupons chart can be filtered by:
- Total number of coupons used
- Total discount amount
- Number of coupons used by coupon code
- Amount of discount by coupon code
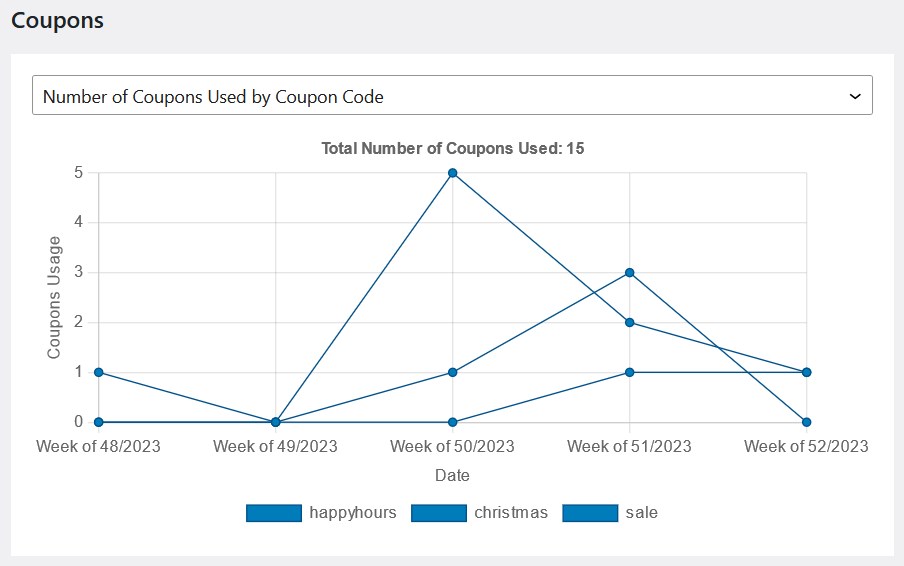
This chart enables you to analyze the effectiveness of your promotional campaigns over time and calculate the net profit generated by coupons by comparing total revenue with coupon redemption costs.
The Payments chart can be filtered by:
- Total number of payments
- Amount by payment gateway
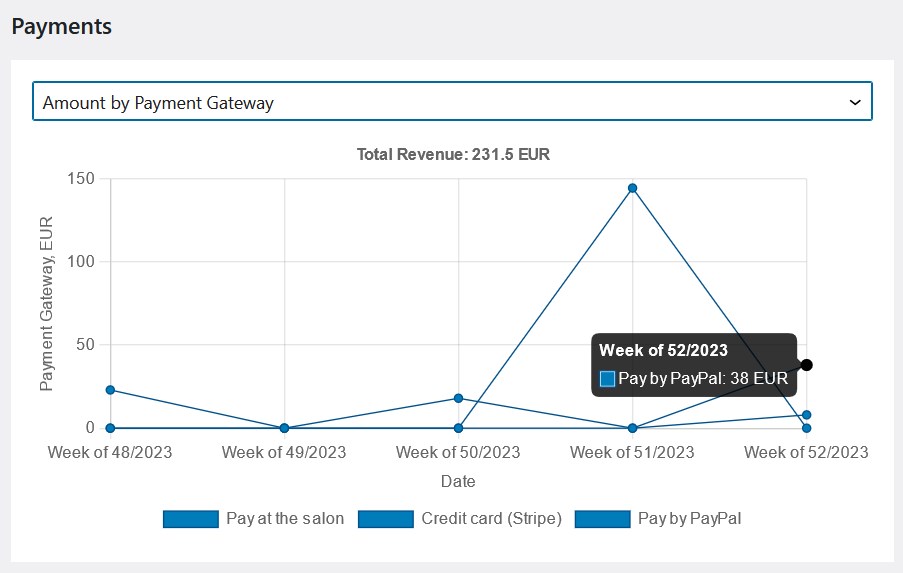
This chart can help you compare payment volume and revenue generated by different gateways, in result, identify preferred payment methods among customers and potential areas for gateway switching.
You need to hover your mouse over a specific line in the chart to see details in a pop-up. You can also click on filters in the legend to delete them from the chart and view details for those items that are left:
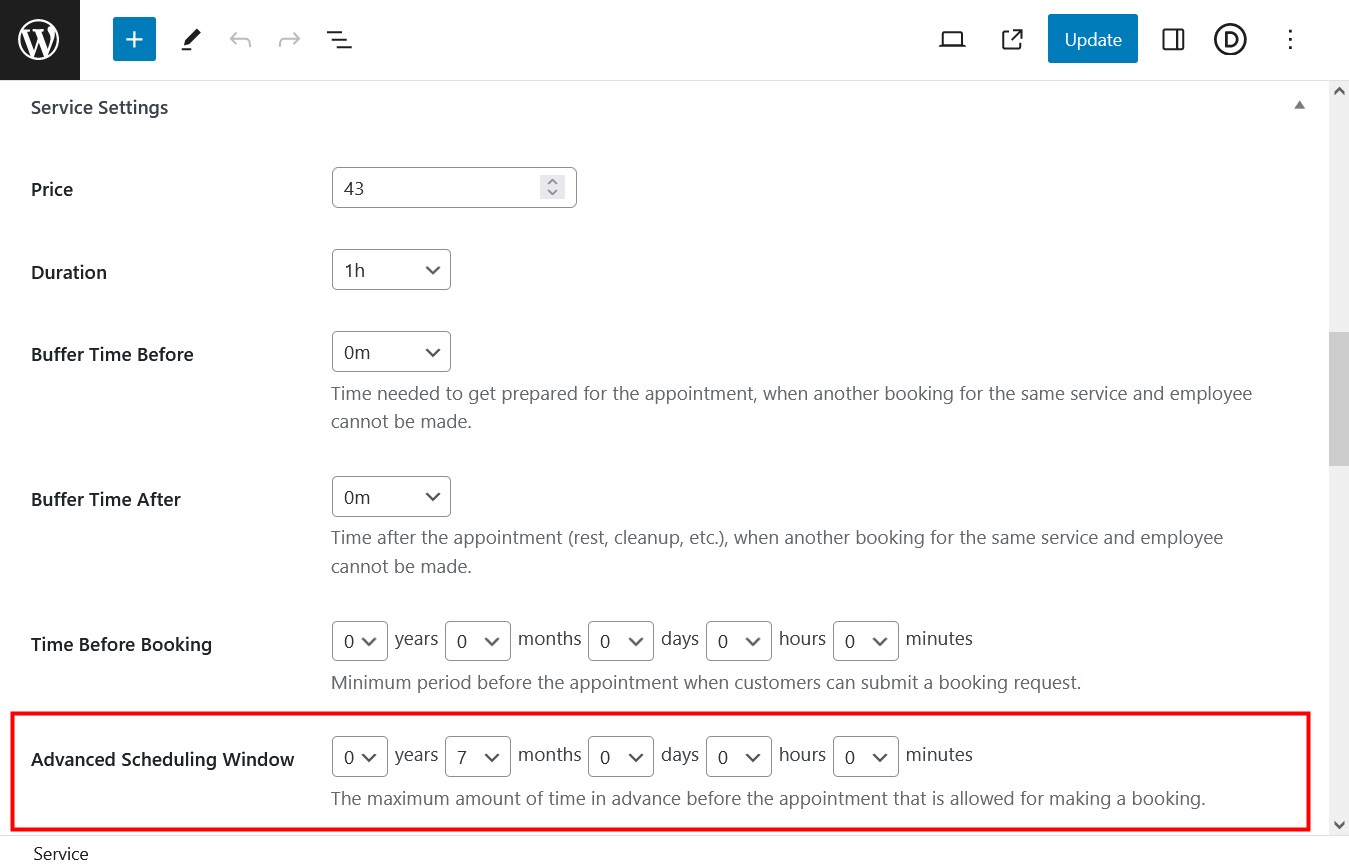
V. 1.21.1 update: Discover the Advanced Scheduling Window for Services
As we were preparing this update review, we released another minor plugin update with a fix and a new feature for customizing Service settings.
Since the Appointment Booking plugin v. 1.21.1, you can also set in how much time in advance before the actual appointment a service can be booked. To set this rule for individual services, just open the needed service and scroll down to Settings > Advanced Scheduling Window > select the timeframe > save the changes.
Final thoughts
To start using the new analytics dashboard, just update your Appointment Booking plugin to the latest version! We are sure you’ll have many ideas on how to use the diversity of these reports to better understand your business. Which other metrics would you like to see in the charts? Let us know in the comments or reach us by email – we’re keen to improve the analytics dashboard in future releases!